One of the goals of TweetingPlaces is to help small local businesses to connect to their customers. One of the ways for them to increase exposure on Twitter may be to schedule tweets of non-immediate importance to times when the message may be seen by most of the followers. The plot above shows activity of followers on Twitter. It may help to get some insights on when to schedule tweets. Still, the best metric can be provided by direct measurements of the reactions on tweets posted at different times.
The plot is for a coffee shop "Изба-читальня" in Donetsk, Ukraine (during winter in UTC +2 timezone). Its tweets can be found at @izba4i . Most of its followers are Donetsk locals and tweet from 9 a.m. till 11 p.m. of local time with peak around 1 p.m. (lunch time).
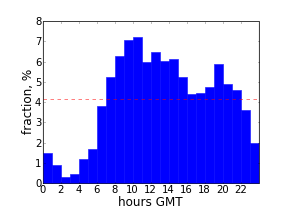
The focus of TweetingPlaces is global, and scheduling tweets at particular times may be not a good strategy, but out of curiosity here is a plot for @tweetingplaces followers:

The minimum is much less pronounced and the followers start tweeting more than average after 8 a.m. Eastern Time.
The code for these plots is available at github. In addition to Matplotlib that has been used in all the previous examples, tweepy library is used to interact with Twitter API (note that you may have to limit number of requests per hour if many of them have to be made). Also, PyYAML does not come in standard library.