If to scale an information service to 1,000 cities what kind of cities will be covered? Or a reverse questions: how many cities have population of more than 1,000,000?
The answers can be found from geonames.org data just with a couple of lines of Python code:
more than 340 cities have population more than 1,000,000; the city ranked 1,000th in that data has population of around 400,000.
This is curious to see how cities population is distributed. The plot below is for cumulative distribution of cities population.
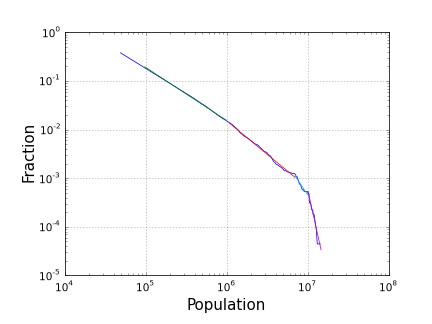
The linear dependence in a log-log plot is an indication of a power law dependence. At some population the distribution changes the slope. Below 1,000,000 inhabitants the slope is almost -1 which indicates 1/x dependence. Then it changes, and changes again at 7 million, and 10 million inhabitants. I would attribute changes at 1 and 10 million to psychology of regional and national governments that treat cities above and below these numbers differently.
Typically, this dependence is plotted in the form of size (population) vs. rank.
Rank-size distribution of cities population was noticed more than half a century ago and is a subject of multiple research studies.
The code to produce the plots is available at github. This is fascinating to play with it: to see if the distribution is universal from a country to country (it's not for large populations), to come up with a simple interpolation formula that approximates it and so on. But, to keep the note brief, these exercises are for a truly curious reader.